The Invisible Menu - Part 4: The Quantification Revolution
Part 4 of the Invisible Menu blog series.
The recipe has been a secret. For decades, laboratories have operated without knowing the complete formula for sample quality. They've counted cells without quantifying debris. They've trusted numbers that hid the contamination. They've served dishes without checking the ingredients.
Today, the recipe is revealed.
Physics-based impedance detection doesn't just count cells differently—it provides the complete ingredient list. Every particle. Every size. Every proportion. The full menu, finally readable.
Ingredient One: Direct Size Measurement
The Coulter principle measures what cameras can only estimate: actual particle volume. When a cell passes through the sensing zone, it displaces electrolyte solution. The resulting impedance change is proportional to the cell's physical size—not its appearance, not its shape, not its optical properties. Its actual volume.
This isn't interpretation. It's measurement. The same physics that transformed clinical hematology, now available for research sample QC.
Why Size Matters
Debris particles are typically smaller than viable cells. When you can measure actual size—not estimated size from pixel analysis—you can separate cell populations from debris populations with physics-based precision. The invisible becomes visible.
Ingredient Two: Complete Population Visualization
Image counters show you cells. They exclude debris from the count. But they never show you what they excluded.
Physics-based detection shows everything. The size distribution histogram reveals the complete population: cells as one peak, debris as another. You see not just how many cells, but what percentage of your sample is contamination.
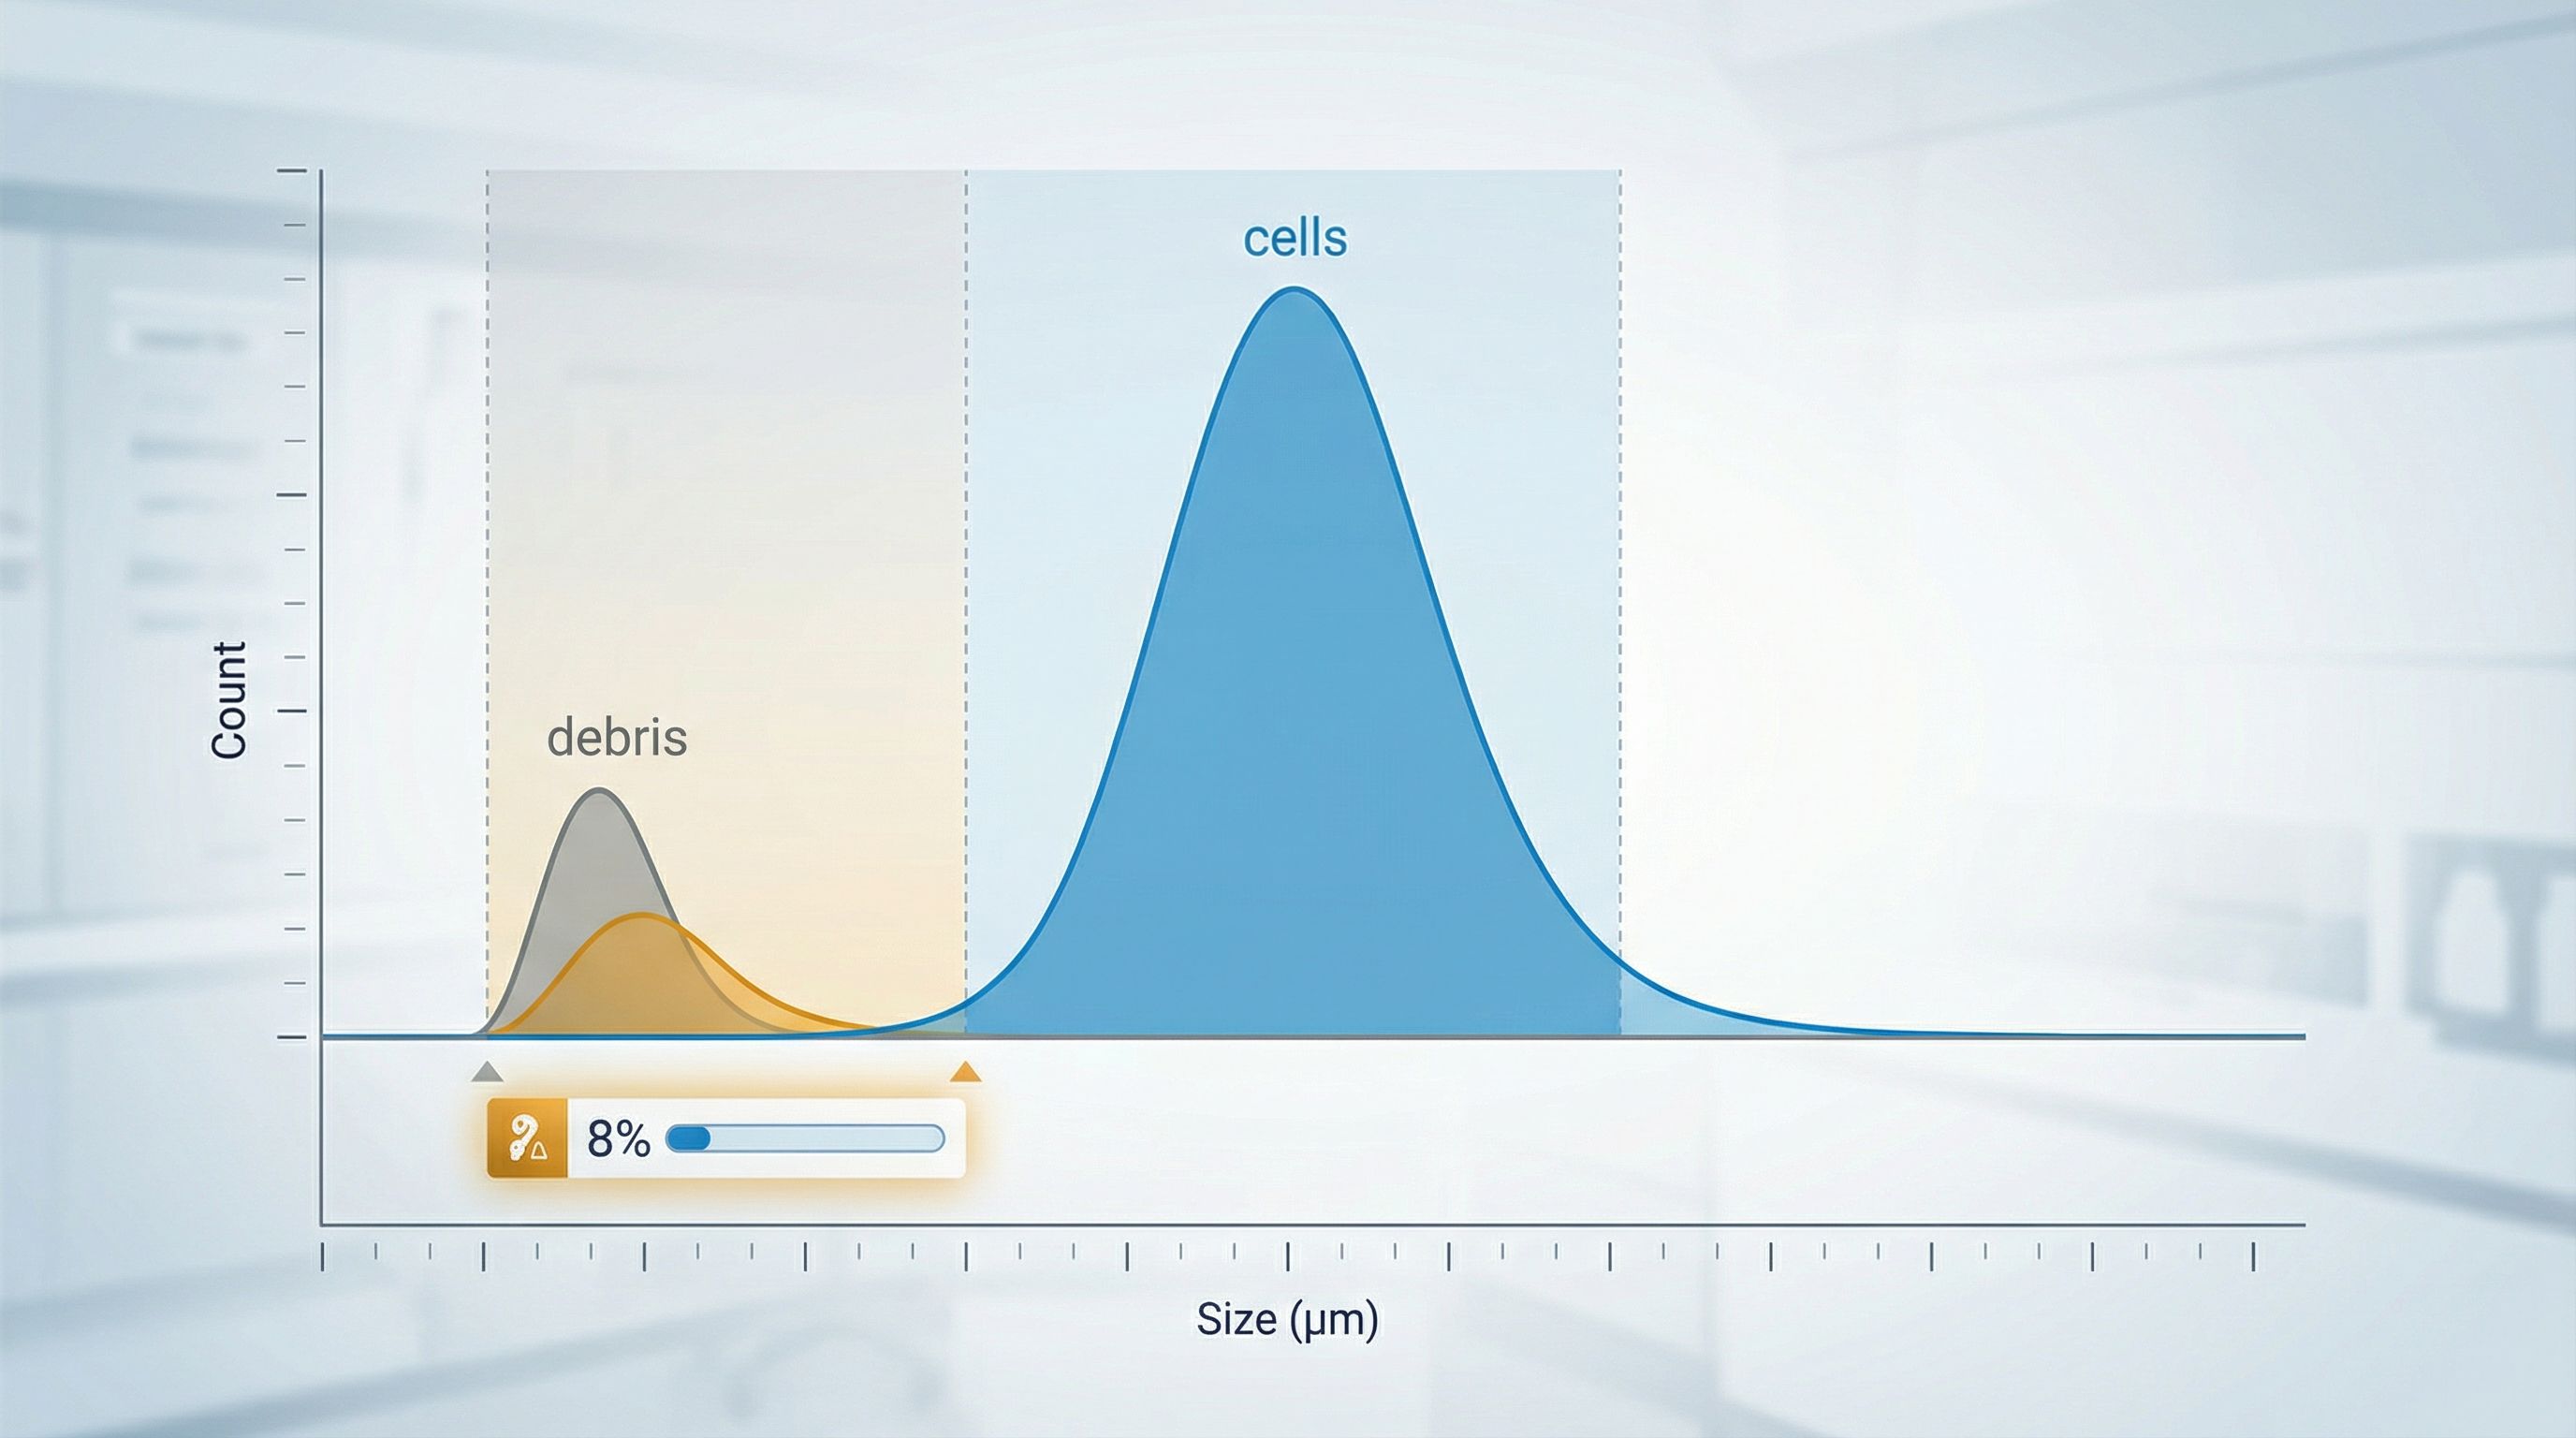
The Debris Percentage Calculation
With complete population data, debris percentage becomes instant arithmetic:
- Total events detected—every particle that passed through the sensing zone
- Cell population identified—particles within your defined cell size range
- Debris population quantified—particles below or outside cell parameters
- Debris percentage calculated—contamination level instantly visible
A sample that looks perfect on an image counter—correct cell concentration, appropriate viability—might reveal 40% debris on physics-based analysis. That 40% would contaminate every downstream application. Now you know before you commit resources.
Ingredient Three: Preset Gates for Standardization
Once you know your sample composition, you can establish standards. What debris percentage is acceptable for your workflow? 10%? 20%? Below what threshold do you proceed, and above what level do you clean up?
Physics-based detection allows you to store these gates. Every user, every timepoint, every sample—measured against the same objective criteria. No more subjective assessments. No more variation between operators. Just standardized QC based on actual measurement.
The SOP Integration
Organizations implementing physics-based debris quantification can establish formal QC thresholds. "Sample must show <15% debris before loading on 10x chip." "Cell-to-debris ratio must exceed 5:1 for downstream viability assays." Preset gates make these requirements enforceable, reproducible, and documentable.
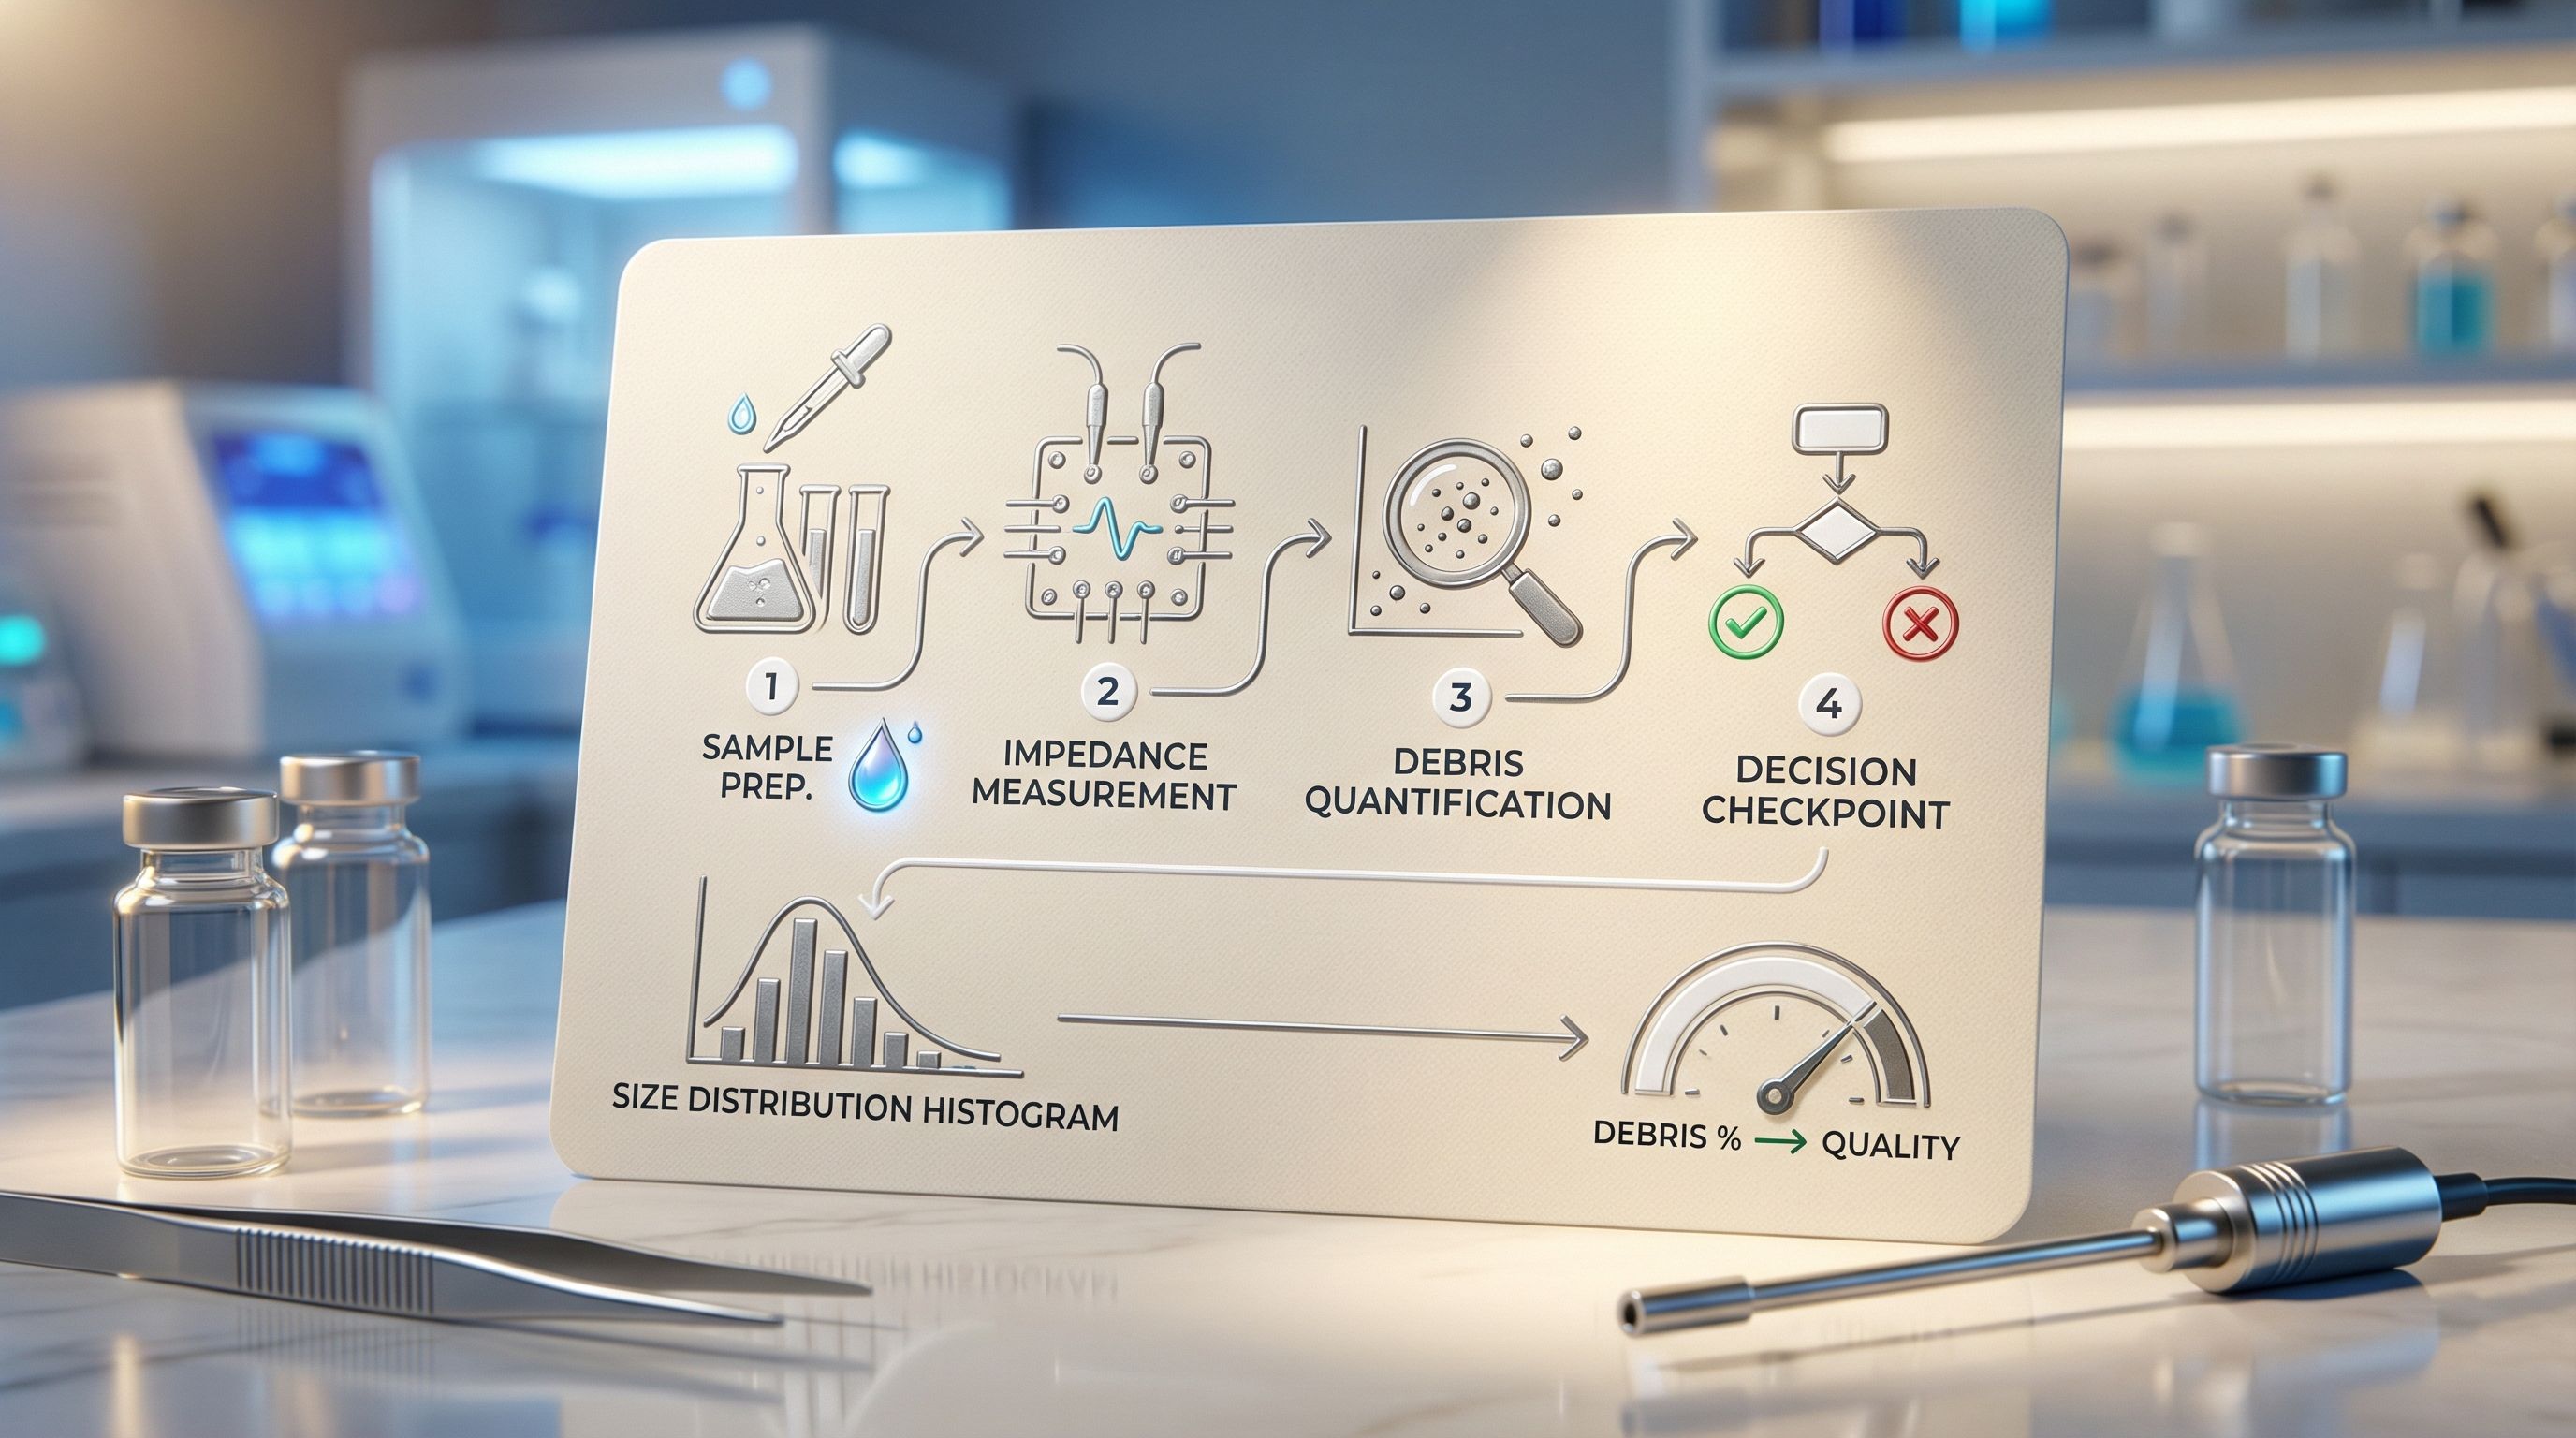
Ingredient Four: The Go/No-Go Decision
This is where the recipe delivers its value. Before committing expensive reagents. Before loading irreplaceable samples onto single-cell chips. Before assuming your count tells the complete story.
You have a decision checkpoint:
- Debris below threshold? Proceed with confidence.
- Debris above threshold? Clean up and re-check.
- Marginal sample? Document and decide based on application requirements.
The invisible menu becomes a decision tool. The villains become quantified variables. The guessing becomes measurement.
The Complete Recipe
Physics-based debris quantification combines four essential ingredients:
- Direct size measurement—Coulter principle impedance detection for actual particle volume
- Complete population visualization—see cells AND debris, not just cells
- Preset gates for standardization—objective, reproducible thresholds across all users
- Go/no-go decision capability—informed choices before resource commitment
Together, these ingredients create something image counters cannot provide: complete sample intelligence. Not just a count. Not just a concentration. The full ingredient list for every dish your laboratory prepares.
Key Takeaway
The recipe for defeating the five villains isn't better algorithms or faster cameras. It's physics-based measurement that reveals what image counters hide: the complete composition of your sample. Direct size measurement. Complete population visualization. Standardized thresholds. Informed decisions. That's the recipe.
In Part 5 of The Invisible Menu, we visit the clean kitchen—the laboratory that finally reads the full menu. The transformation from blind trust to evidence-based QC. The victory that comes from seeing everything.
Get the Complete Recipe
Learn how physics-based debris quantification can transform your sample QC workflow.